This module is designed to present the parameters in the form of graphs.
Working with the Graph module
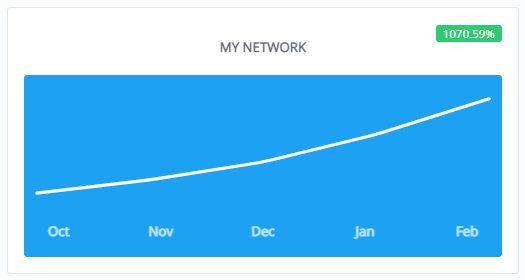
The module is a graph that displays information on the chosen parameter for different periods.
The graph display can be flexibly adjusted according to the parameters shown in the table below.
Configuration
| props | type | default | description |
| accountId | Number | Distributor account ID |
|
| gradient | String | [ ] | Gradient settings |
| gradientDirection | String | top | Gradient direction |
| type | String | trend | Graph type |
| title | String | Graph title |
|
| lineCap | String | round | The icon when hovering over the graph |
| color | String | primary | The color of the text, when hovering over the graph |
| backgroundColor | String | inherit | Background color |
| metric | String | The parameter to be displayed on the graph |
|
| radius | String, Number | 4 | Кounding the graph line |
| padding | String, Number | 8 | Indents |
| lineWidth | String, Number | 2 | Line width |
| intervals | String, Number | 4 | Number of intervals |
| fill | Boolean | FALSE | If set, the area under the curve will be filled with the background color |
| autoLineWidth | Boolean | FALSE | If set, the line width is set automatically |
Peter D
Comments